Proof of
Performance
Four case studies. Each one has a client, a period, and figures that reconcile. I removed six others in July 2026. They were percentages without a baseline. A conversion rate up 142% with no starting point is not evidence, it is decoration. If I cannot show you the working, it does not go on this page.
The Proof is in the Ledger: Verified Ad Account Receipts
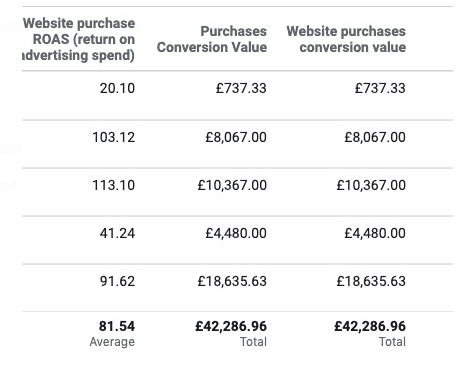
Raw Meta Ads Manager performance across five active ad sets.
| # | ROAS | Conv. Value |
|---|---|---|
| 1 | 20.10x | £737.33 |
| 2 | 103.12x | £8,067.00 |
| 3 | 113.10x | £10,367.00 |
| 4 | 41.24x | £4,480.00 |
| 5 | 91.62x | £18,635.63 |
| AVG | 81.54xAverage ROAS | £42,286.96Total Conversion Value |
About the 81.54x
That is the average across five ad sets in a Meta Ads Manager account. Total conversion value £42,286.96. The screenshot is real and I will show you the account.
Read the caveats, because they matter more than the number.
It is an ad set average, not an account average. It excludes everything that did not perform.
And the absolute numbers are small. A 100x return on a few hundred pounds is a good afternoon, not a business.
“Why ROAS Lies” is a different brand, in 2025, in a different category. That one is not a dashboard. It is a forensic audit that found a reported 3.1x ROAS was a true 1.4x once you stripped out returning customers and Klaviyo overlap, and that 30% to 40% of ninety days of spend was waste.
Both are true. They are not in conflict. One is what Meta said. The other is what the business actually got.
So I have left the banner up, because deleting it would be tidier and less honest. But I do not sell on it.